import matplotlib.pyplot as plt
from datetime import date
from functools import partial
import numpy as np
from sympy import Max

from epymorph.kit import *
from epymorph.adrio import acs5Hospitalization IPM
SCENARIO:
In many human disease outbreaks, hospitals and hospitalization policies can have an enormous impact on overall outcomes, e.g., hospitalized persons may die at a lower rate, and may infect fewer others due to being isolated from the susceptible population. In addition, modeling hospitalization is vital for predicting evolving load on local hospital capacity, including the threat of exceeding that capacity.
The exercises in this vignette will show you how to add a basic hospitalization compartment to your model, and use it to explore some of the above hospitalization-related dynamics.
Exercise 1
class initSIRH_ipm(CompartmentModel):
    compartments = [
        compartment('S'),
        compartment('I'),
        compartment('R'),
        compartment('H'),
    ]
    requirements = [
        AttributeDef('beta', type=float, shape=Shapes.TxN,
                     comment='infectivity'),
        AttributeDef('h_rate', type=float, shape=Shapes.TxN,
                     comment='progression from infected to hospitalized'),
        AttributeDef('h_recovery', type=float, shape=Shapes.TxN,
                     comment='progression from hospitalized to recovered'),
    ]

    def edges(self, symbols):
        [S, I, R, H] = symbols.all_compartments
        [β, h_rate, h_rec] = symbols.all_requirements

        N = Max(1, S + I + R + H)

        return [
            edge(S, I, rate=β * S * I / N),
            edge(I, H, rate=h_rate * I),
            edge(H, R, rate=h_rec * H),
        ]
sirh_ipm = initSIRH_ipm()
sirh_ipm.diagram()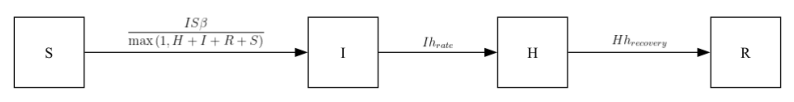
# Use Coconino County, AZ
scope = CountyScope.in_counties(['Coconino, AZ'], year=2020)
my_init = init.SingleLocation(location=0, seed_size=10)
null_mm = mm.No()- [] Create a RUME and run the simulation.
rume = SingleStrataRUME.build(
    ipm=initSIRH_ipm(),
    mm=null_mm,
    init=my_init,
    scope=scope,
    time_frame=TimeFrame.of("2020-01-01", 200),
    params={
        'beta': 0.4,
        'h_rate': 1 / 10,
        'h_recovery': 1 / 50,
        'population': acs5.Population(),
    }
)

sim = BasicSimulator(rume)
with sim_messaging(live = False):
    out = sim.run(
        rng_factory=default_rng(5),
    )
Loading gpm:all::init::population (epymorph.adrio.acs5.Population):
|####################| 100% (0.793s)
Running simulation (BasicSimulator):
• 2020-01-01 to 2020-07-18 (200 days)
• 1 geo nodes
|####################| 100%
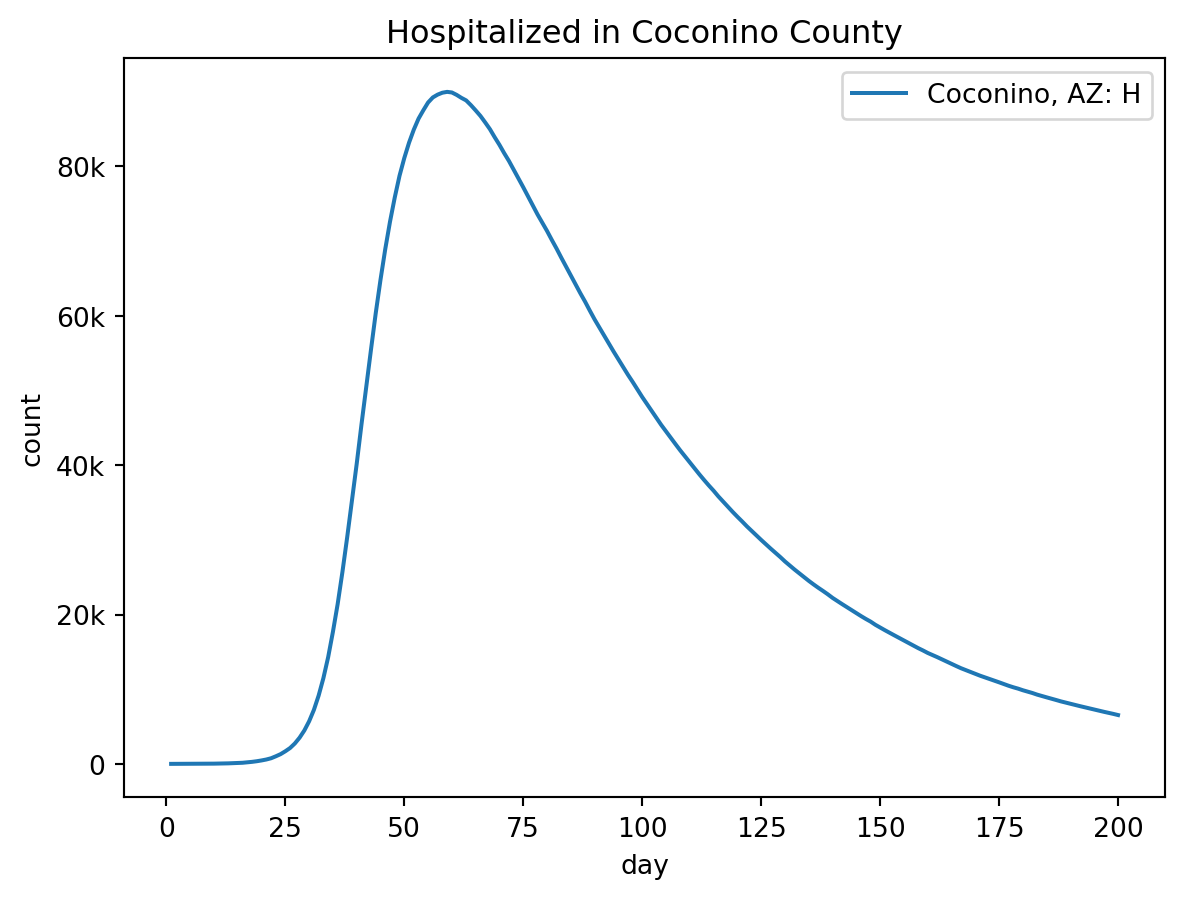
Runtime: 0.038sout.plot.line(
geo=out.rume.scope.select.all(),
time=out.rume.time_frame.select.all(),
quantity=out.rume.ipm.select.compartments("H"),
title="Hospitalized in Coconino County",
)
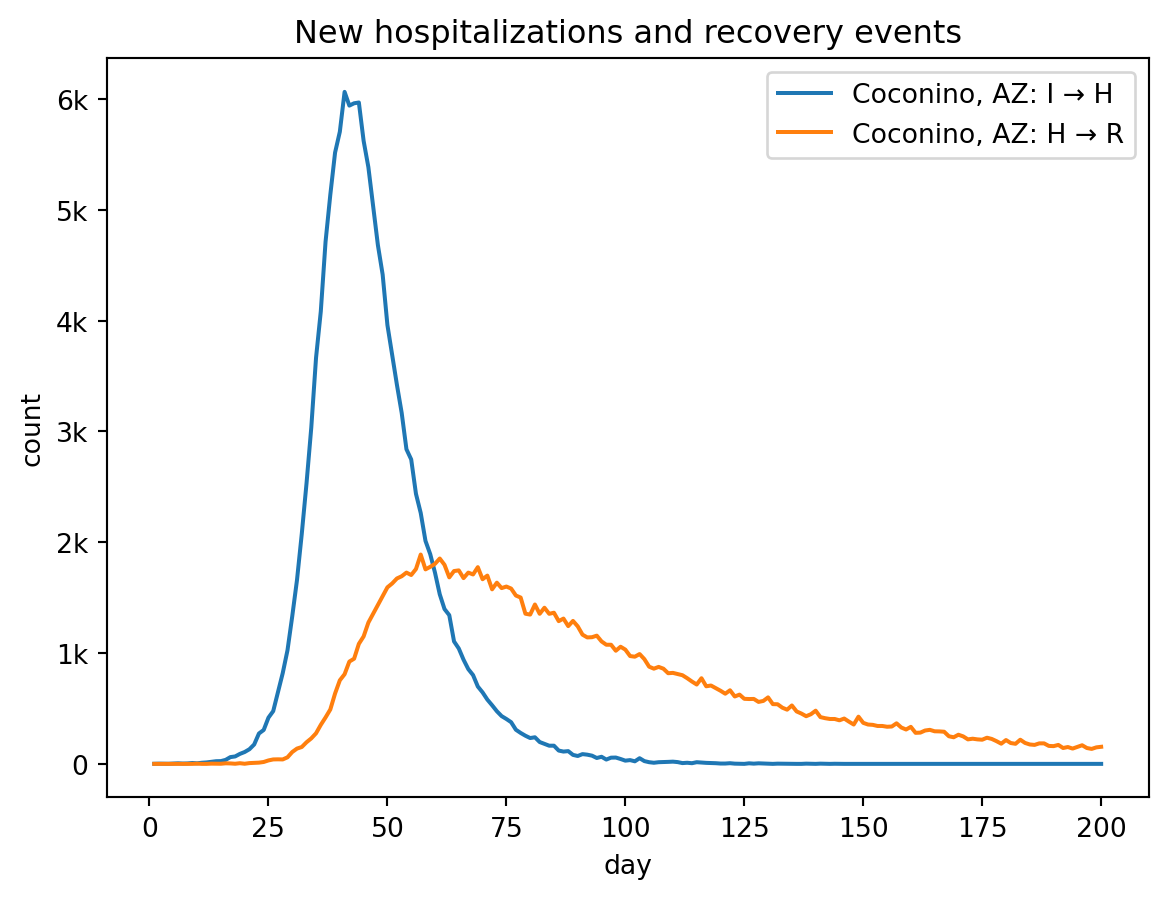
out.plot.line(
    geo=out.rume.scope.select.all(),
    time=out.rume.time_frame.select.all(),
    quantity=out.rume.ipm.select.events("I->H", "H->R"),
    title="New hospitalizations and recovery events",
)
Exercise 2
# create hospitalization ipm with fork
class SIRH_ipm(CompartmentModel):
    compartments = [
        compartment('S'),
        compartment('I'),
        compartment('R'),
        compartment('H'),
    ]
    requirements = [
        AttributeDef('beta', type=float, shape=Shapes.TxN,
                     comment='infectivity'),
        AttributeDef('h_rate', type=float, shape=Shapes.TxN,
                     comment='progression from infected to hospitalized or recovered'),
        AttributeDef('h_recovery', type=float, shape=Shapes.TxN,
                     comment='progression from hospitalized to recovered'),
        AttributeDef('h_prob', type=float, shape=Shapes.TxN,
                     comment='probablity for hospital versus recovered'),
    ]

    def edges(self, symbols):
        [S, I, R, H] = symbols.all_compartments
        [β, h_rate, h_rec, h_prob] = symbols.all_requirements

        N = Max(1, S + I + R + H)

        return [
            edge(S, I, rate=β * S * I / N),
            fork(
                edge(I, H, rate=h_rate * I * h_prob),
                edge(I, R, rate=h_rate * I * (1 - h_prob)),
            ),
            edge(H, R, rate=h_rec * H)
        ]
sirh_ipm2 = SIRH_ipm()
sirh_ipm2.diagram()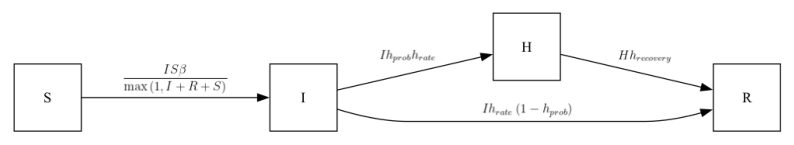
rume = SingleStrataRUME.build(
    ipm=SIRH_ipm(),
    mm=null_mm,
    init=my_init,
    scope=scope,
    time_frame=TimeFrame.of("2020-01-01", 200),
    params={
        'beta': 0.4,
        'h_rate': 1 / 10,
        'h_recovery': 1 / 50,
        'h_prob': 0.10,
        'population': acs5.Population(),
    }
)

sim = BasicSimulator(rume)
with sim_messaging(live = False):
    out = sim.run(
        rng_factory=default_rng(5),
    )
Loading gpm:all::init::population (epymorph.adrio.acs5.Population):
|####################| 100% (0.741s)
Running simulation (BasicSimulator):
• 2020-01-01 to 2020-07-18 (200 days)
• 1 geo nodes
|####################| 100%
Runtime: 0.047sout.plot.line(
geo=out.rume.scope.select.all(),
time=out.rume.time_frame.select.all(),
quantity=out.rume.ipm.select.events("I->H", "I->R"),
title="New hospitalizations and recovery events",
)
stored_sim_results = []
probs = [.01, .05, .10, .20]

for p in probs:
    rume = SingleStrataRUME.build(
        ipm=SIRH_ipm(),
        mm=null_mm,
        init=my_init,
        scope=scope,
        time_frame=TimeFrame.of("2020-01-01", 200),
        params={
            'beta': 0.4,
            'h_rate': 1 / 10,
            'h_recovery': 1 / 50,
            'h_prob': p,
            'population': acs5.Population(),
        }
    )

    sim = BasicSimulator(rume)
    out = sim.run(
        rng_factory=default_rng(8),
    )
    stored_sim_results.append(out)
fig, ax = plt.subplots()
for j in stored_sim_results:
j.plot.line_plt(
ax = ax,
geo=j.rume.scope.select.all(),
time=j.rume.time_frame.select.all(),
quantity=j.rume.ipm.select.events("I->H"),
)
ax.set_xlabel("day")
ax.set_ylabel("I to H events")
ax.set_title("Varying the probability of hospitalization")
ax.grid(False)
fig.tight_layout()
plt.show()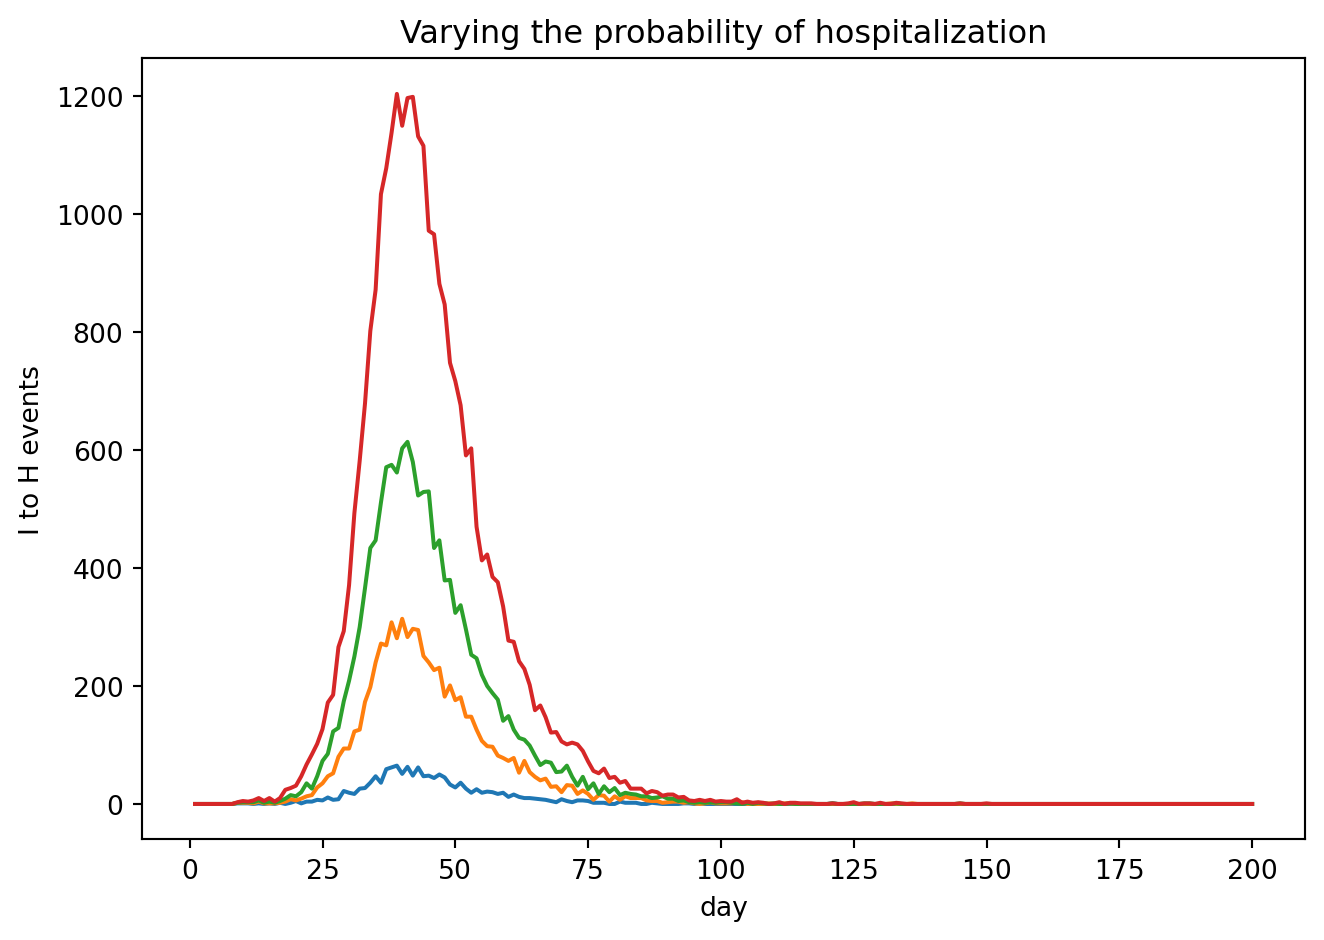
Exercise 4
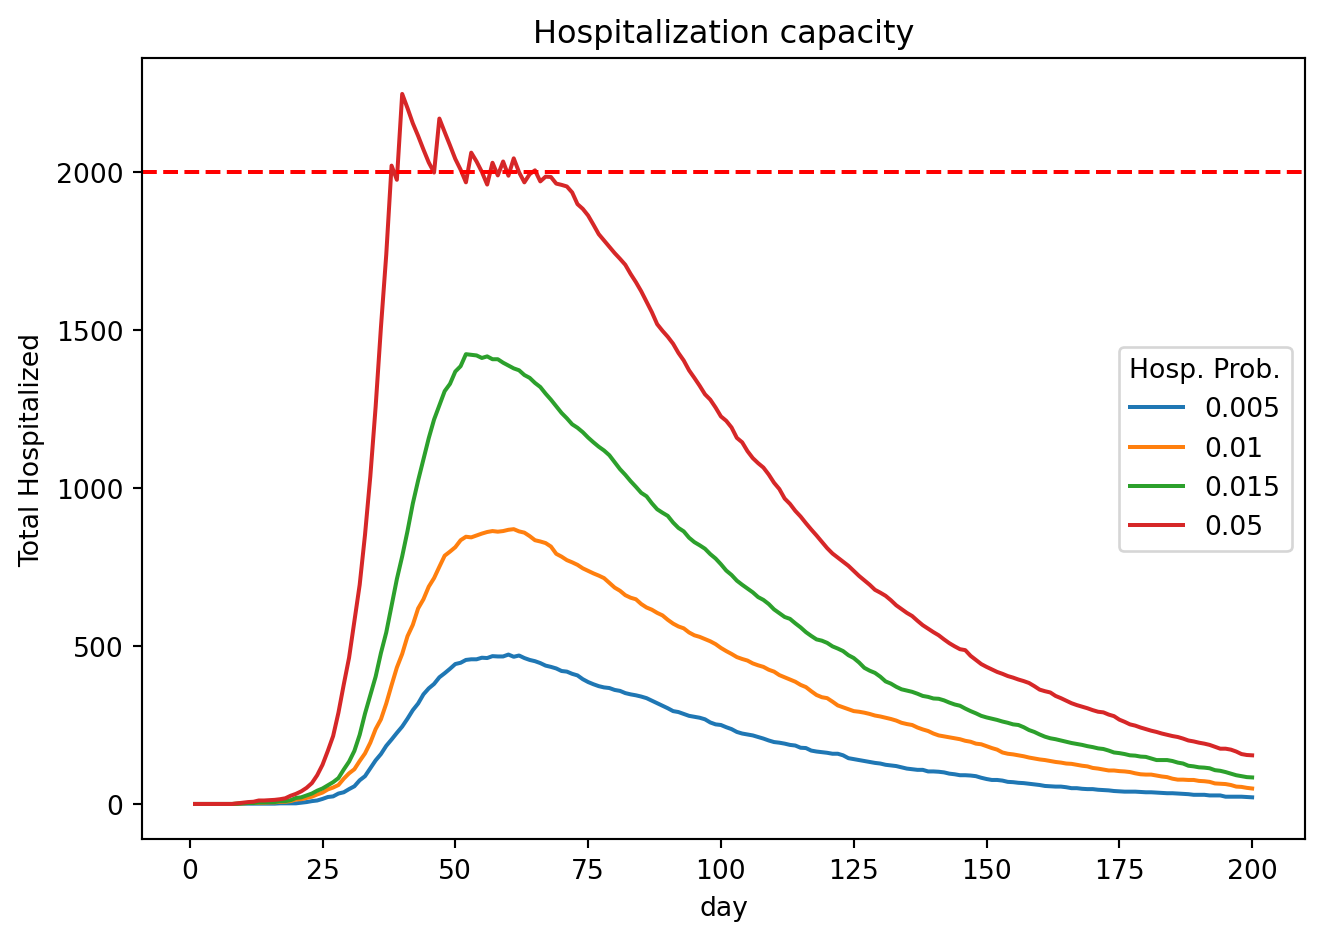
Making the limits real. What would happen if the hospital bed capacity were actually reached? In simplest terms, the ‘H’ compartment would be full, and should not be allowed to grow anymore. Let’s explore how this could be modeled in epymorph. Change the static hospitalization rate (h_rate) on the I→H edge to be represented by a stepwise function, described by the following pseudo-code: “If H< capacity h_rate=value1, else h-rate=0”, to cut off flow to the ‘H’ compartment anytime the hospital is reaching capacity. Now run your simulation again, to see if the ‘H’ compartment ever exceeds its capacity.
from sympy import Piecewise

# custom ipm to use simpy to stop at the max bed capacity (stepwise or traditional function)
class SIRH_new(CompartmentModel):
    compartments = [
        compartment('S'),
        compartment('I'),
        compartment('R'),
        compartment('H'),
    ]

    requirements = [
        AttributeDef('beta', type=float, shape=Shapes.TxN,
                     comment='infectivity'),
        AttributeDef('h_rate', type=float, shape=Shapes.TxN,
                     comment='progression from infected to hospitalized or recovered'),
        AttributeDef('h_recovery', type=float, shape=Shapes.TxN,
                     comment='progression from hospitalized to recovered'),
        AttributeDef('h_prob', type=float, shape=Shapes.TxN,
                     comment='probablity for hospital versus recovered'),
        AttributeDef('capacity', type=float, shape=Shapes.TxN,
                     comment='allowed capacity of hospital beds'),
    ]

    def edges(self, symbols):
        [S, I, R, H] = symbols.all_compartments
        [β, y, h_rec, h_prob, capacity] = symbols.all_requirements

        N = Max(1, S + I + R + H)

        return [
            edge(S, I, rate=β * S * I / N),
            fork(
                edge(I, H, rate=Piecewise((y * I * h_prob, H < capacity), (0, True))),
                edge(I, R, rate=y * I * (1 - h_prob)),
            ),
            edge(H, R, rate=h_rec * H),
        ]

# store hospitalization ipm
# hospital bed capacity (hypothetical)
capacity = 2000.0
stored_sim_results = []
probs = [.005, .01, .015, .05]
for p in probs:
rume = SingleStrataRUME.build(
ipm=SIRH_new(),
mm=null_mm,
init=my_init,
scope=scope,
time_frame=TimeFrame.of("2020-01-01", 200),
params={
'beta': 0.4,
'h_rate': 1 / 10,
'h_recovery': 1 / 50,
'h_prob': p,
'capacity': capacity,
'population': acs5.Population(),
}
)
sim = BasicSimulator(rume)
out = sim.run(
rng_factory=default_rng(8),
)
stored_sim_results.append(out)fig, ax = plt.subplots()
for j in stored_sim_results:
j.plot.line_plt(
ax = ax,
geo=j.rume.scope.select.all(),
time=j.rume.time_frame.select.all(),
quantity=j.rume.ipm.select.compartments("H"),
)
ax.set_xlabel("day")
ax.set_ylabel("Total Hospitalized")
ax.set_title("Hospitalization capacity")
ax.grid(False)
plt.legend(probs, title="Hosp. Prob.")
plt.axhline(y=capacity, color='red', linestyle='--')
fig.tight_layout()
plt.show()